Health trajectories
Tarani Chandola, CCSR.
Summary
Health trajectories are descriptions (usually in terms of lines or curves) of how a person’s health changes as they get older. They are estimated from growth curve models with health as the outcome. Growth curve models analyse outcomes that have been repeatedly measured over a period of time, in order to describe and quantify changes in that outcome over the time period. Growth curve models are usually fitted in using latent variable methods or with multilevel methods. Both methods give similar results, although the substantive question may result in preferring one method over another.
In health, growth curve models are typically used to describe changes in a person’s development, health or functioning as they age. Once a growth curve model has been fitted, the estimated parameters from the model can be used to draw a trajectory of the predicted changes in the (health) outcome over a period of time. These graphs of health trajectories are a powerful tool of summarizing complex patterns of change.
Experts/users at Manchester
Relevant projects
Social inequalities in functional decline in early old age
This project analysed a group of middle-aged British civil servants (the Whitehall II study) as they entered into retirement age. It examined whether inequalities in health increased as this group got older.
- Social inequalities in self reported health in early old age: follow-up of prospective cohort study - British Medical Journal
- Whitehall ll study on University College London website
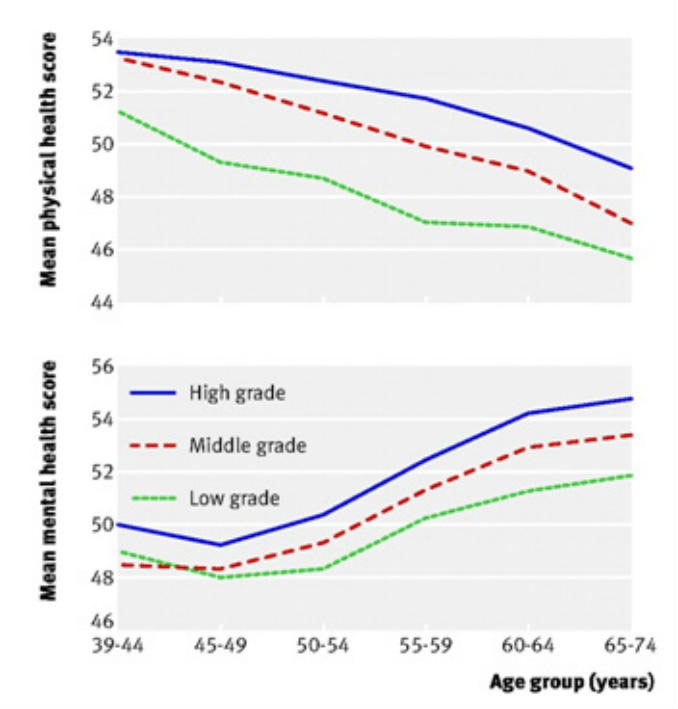
Fig 1: Mean SF-36 physical component scores and mental component scores by age group: Whitehall ll respondents from phases 3-7. Chandola, T. et al. BMJ 2007; 334:990. Copyright 2007 BMJ Publishing Group.
Child-to-adult body mass index and height trajectories: A comparison of two British birth cohorts
This project examined the extent to which there has been a generational change in the trajectories of height and obesity of British children and adults.
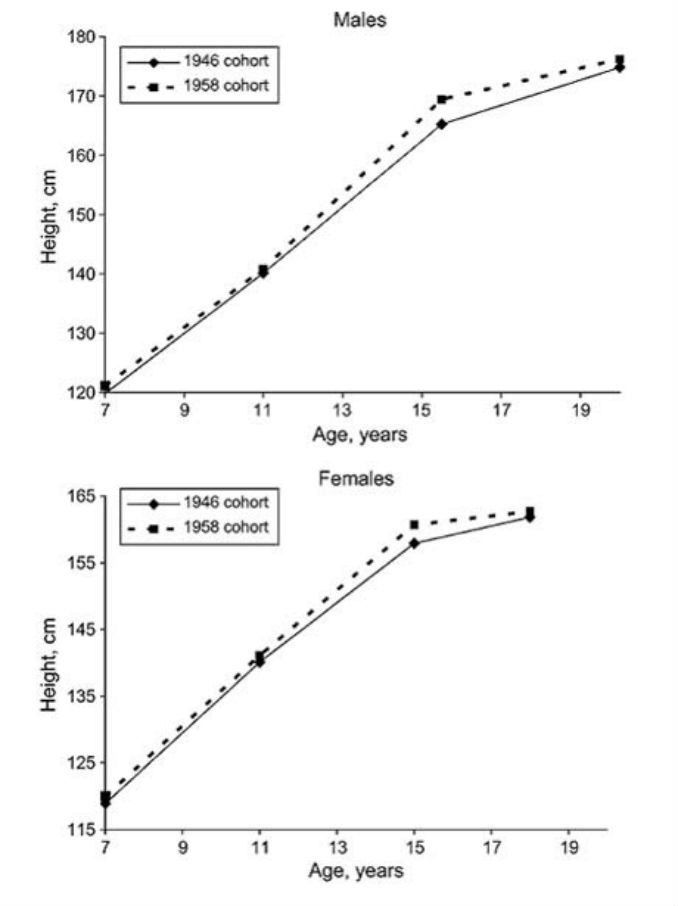
Figure 1: Height trajectories for the 1946 and 1958 British cohorts. Childhood height was centred at 7,11 and 15.5 years; observed adult height (measured at 43 years in the 1946 cohort and 45 years in the 1958 cohort) was plotted at 20 years for males and 18 years for females.
Links to online resources
- Latent Growth Curve Analysis: A Gentle Introduction - Alan C. Acock
- Statistical analysis with latent variables
- Longitudinal Data Analysis: Multilevel modelling and Structural Equation Modelling Approaches, 20-21 September 2010, Bristol. Materials will be available after the workshop
- Mlwin user’s guide: Chapter on Repeated Measures Data.
Staff interested in health trajectories
- Prof Jianxin Pan (Mathematics), Probability & Statistical analysis
- Dr Richard Elmsley (Medicine), Statistical methods for causal inference
- Prof Graham Dunn (Medicine), Biomedical Statistics
- Prof Ian Plewis (School of Social Sciences), Design and analysis of longitudinal studies; survey methods; changes across the lifecourse.
- Dr Gindo Tampubolon (Social Sciences), Social change
- Dr Nick Shryhane (Social Sciences), Social Statistics
- Prof Tarani Chandola (Social Sciences), Explaining social inequalities in health; The analysis of longitudinal cohort data
PDF slides
Download PDF slides of the presentation 'What is a health trajectory?'